You know the feeling, don’t you? You open your call center analytics dashboard, see all those colorful charts and graphs, and think, “Okay… what now?”
I’ve been there. We’ve all been there. Those pretty visualizations sitting on our screens, full of potential insights, but somehow leaving us more confused than enlightened.
Here’s the thing that really got me thinking: 87% of organizations are considered “low maturity” in analytics. That means they’re collecting all this data—mountains of it—but they have no clue what to do with it.
Funny? Maybe. Painful? Absolutely. But here’s what I’ve learned: the gap between collecting data and understanding it isn’t about intelligence—it’s about knowing where to look and what questions to ask.
What call center analytics really means (beyond the buzzwords)
Let me start with something simple: call center analytics isn’t just about numbers. It’s about understanding the stories those numbers tell about your customers, your team, and your business.
Call center analytics analyzes data collected from various customer touchpoints to uncover valuable insights that improve customer satisfaction, boost operational efficiency, and overall enhance contact center performance.
For example, analytics can reveal when your team is overwhelmed with calls, which scripts lead to better outcomes, or why certain issues keep recurring, etc. Analytics help you identify and resolve problems before they escalate.

But where do these data points come from? They come from various customer touchpoints, and these are:
- Call recordings
- Interactive voice response (IVR) logs
- Chat and email
- Customer surveys
- CRM data
Put together, these inputs create a complete picture of your contact center performance — but the real value starts when you realize why businesses should understand and act on that picture.
Read Also: A Complete Call Center Software Guide for Your Business
Why this actually matters (the human cost of bad data)
Let’s talk numbers for a second. Companies that read and interpret their data see some pretty incredible results, like:
Optimizing agent performance
Analyzing data reduces the average handle time (AHT) by 40%, which enables agents to resolve customer issues more efficiently. This means shorter wait times for customers and better-managed workload for teams.
Improves customer experience
Research shows that over 70% of call centers that consistently track their first call resolution (FCR) rate or first contact resolution for a year or more see a 1% to 10% annual improvement in FCR rates. Since a higher FCR is directly linked to higher CSAT scores, analyzing data becomes essential for delivering a better customer experience.

Better operational efficiency
Data analysis uncovers inefficiencies and bottlenecks in campaigns, helping managers to streamline workflows. This, in turn, improves overall efficiency and productivity by up to 60%.
Increases conversion rate
According to McKinsey, understanding data insights to optimize your outreach and engagement can increase conversion rates by nearly 50%.
Here’s a quick look at how different teams benefit from call center analytics data:
| Department | How They Benefit From Call Center Analytics |
|---|---|
| Operations managers | Optimize staffing, boost agent productivity, and cut hold times using a contact center dashboard. |
| Customer experience leads | Identify pain points, track key performance indicators (KPIs) of the call center, and enhance service delivery. |
| Senior executives | Align strategy with business goals, drive growth, and foster a data-driven culture. |
| Quality assurance | Use call monitoring to ensure compliance and coach agents for better outcomes. |
| Marketing & sales | Understand customer sentiment, measure campaign impact, and improve conversions. |

When you have access to the right data, decision-making becomes easier, faster, and more effective. So, what exactly should you be tracking to get these results? Let’s take a look at that.
Key metrics to track in call center analytics
When managers start tracking the right contact center performance metrics, they stop guessing and start making data-driven decisions.
Studies show that such decisions can improve customer retention by 6 times and make businesses 19 times more likely to be profitable.
You don’t need to track everything. But you do need to track what moves the needle. Here’s what to focus on:
| Type of data | Description |
|---|---|
| Customer interaction data | This covers all activity between your team and customers — calls, emails, chats, and texts (all recorded). You will see how many calls come in, how often they’re answered, and the call duration. |
| Agent performance metrics | Shows how well your agents are doing. Measures include the total calls made by agents, first-call resolution rates, average handle times, and more. Helps spot top performers and coaching needs. |
| Operational KPIs | This tracks the big picture of your call center, including overall cost, average session duration, and call dispositions. |
| Customer feedback | Direct input from customers through surveys and post-call ratings. Helps you understand customer satisfaction and identify areas for improvement. |
| Campaign performance data | Shows how well your outreach is doing via call conversions, unique contacts reached, and ROI insights. |
Read Also: The Latest Call Center Monitoring Tips You Need In 2025
Here’s what gaglers call center analytics provide
Our customers asked, and we listened. Gaglers has curated highly segmented and advanced call center analytics that help teams win, shift strategy, and gain invaluable insights.
Gaglers simplifies call center analytics by consolidating powerful KPIs into a single, intuitive contact center dashboard, making it easier for managers, QA teams, and senior leaders to track what matters most. Here’s what’s inside:
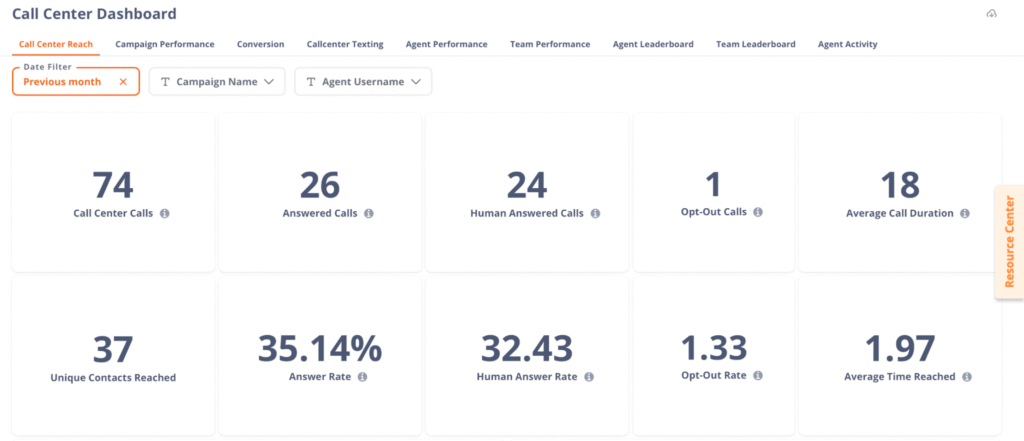
1. Advanced metabase analytics
Get deep, visual insights across all your campaigns and agent data using Metabase. Track everything—call center activity, agent KPIs, campaign results, conversions, your entire team’s performance, and even question-level deep dives.
Gaglers visualizes the performance of your cloud call center in a way that’s easy to explore and understand, with numbers.
✅ It’s ideal for QA teams and operations managers seeking actionable insights to improve campaign performance.
2. Advanced analytics
Available for pro users only, this is your call center analytics playground. You can:
- Create custom dashboards with your preferred KPIs. In the image, you can see how Sam has customized his dashboard to match the needs of his campaign, including setting a goal of 10 for the “Answer Rate” metric.
- Dashboard elements are fully editable, so you can build views that focus on what matters most to your team.
- Pro users gain granular visibility to explore raw data.
- Businesses can drill down into data from high-level KPIs to individual records.
✅ Perfect for businesses running multiple campaigns, or for teams with a dedicated analyst who needs granular, flexible reporting on contact center performance.
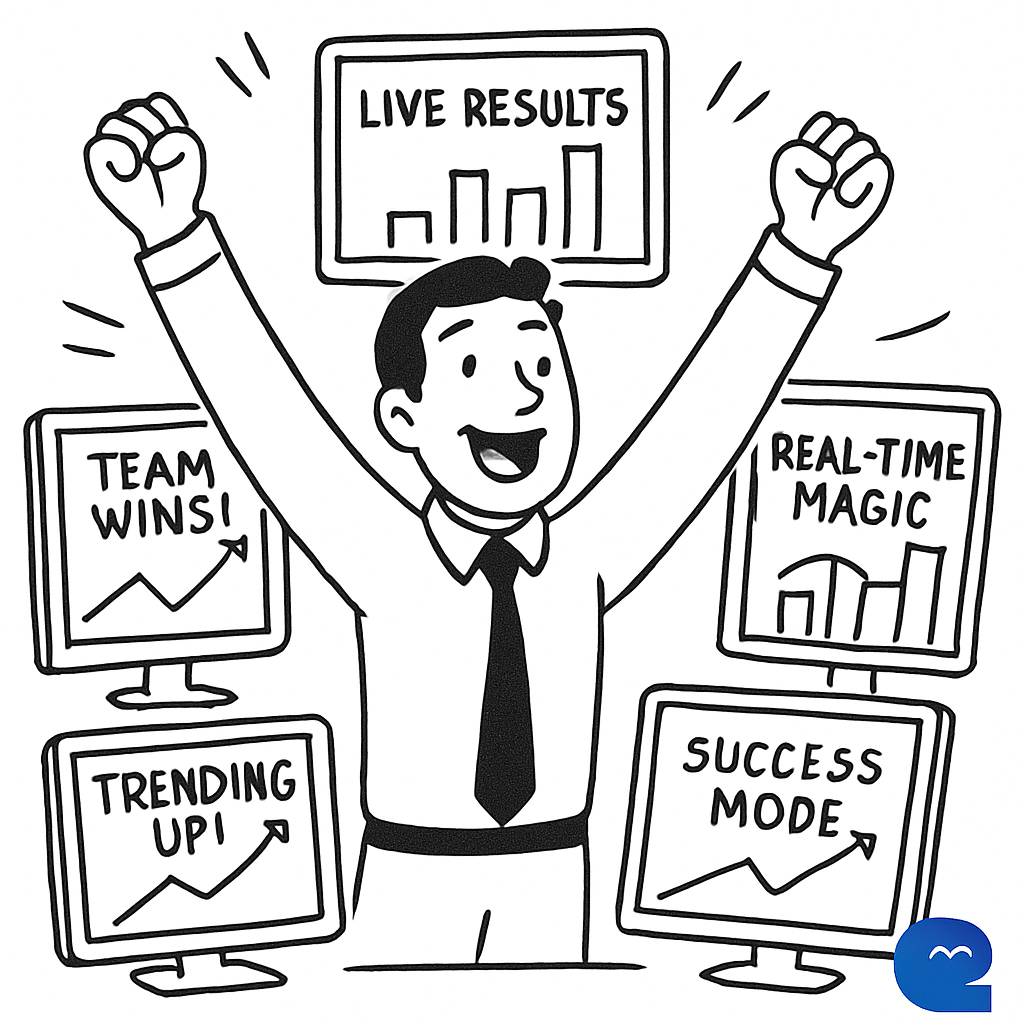
3. Real-time monitoring with live reports
A survey by McKinsey found that organizations leveraging real-time data can improve productivity by as much as 20-30%. Gaglers offers real-time call monitoring with live data streaming as campaigns run. Supervisors can:
- Watch outcomes unfold in real time.
- Identify issues early and act quickly.
- Celebrate team wins on the spot.
In the visual below, you can track metrics such as Agents Online (AO), Total Dials (TD), Agents on Call (AOC), Total calls connected to agents (TCCA), etc.
✅ Great for fast-paced, dynamic campaigns—especially in customer service, and sales environments where timing is everything.
4. Live agent and team leaderboards
Inject a bit of friendly competition with Gaglers’ Leaderboards. See top-performing agents and teams ranked by:
- Number of calls made
- Talk time
- Connect time
Leaderboards create visibility, helping both agents and supervisors track progress and performance.
Report downloads
Gaglers lets you download detailed call center analytics reports in three easy-to-use formats:
- .CSV
- .XLSX
- .JSON
Whether you’re building presentations, importing into BI tools, or archiving campaign history, you’ll have the data in the format that works best for your workflow.
Here’s a Gaglers PRO TIP
Master the 3 C’s of the call center that help to strengthen your analytics.
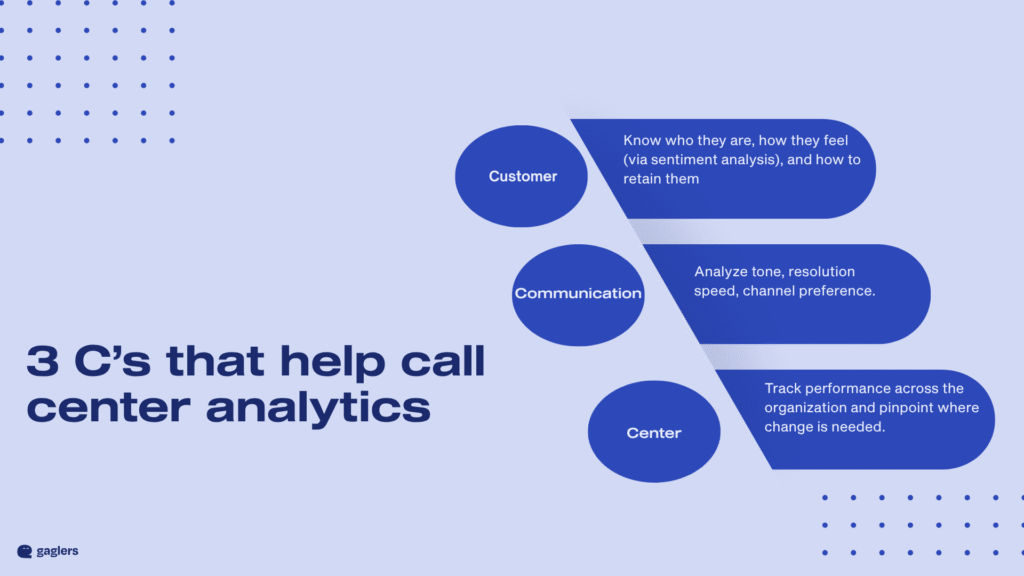
Analytics is the bridge that connects these three to drive better performance.
Best practices for call center analytics
Now you’ve got dashboards, metrics, reports—but that’s not the finish line. It’s the start of smarter decisions. Call center analytics aren’t a one-time thing. You need to live with data every day. Keep an eye on it.

Follow the best practices to keep your call center running smoothly:
1. Define focus KPIs: Don’t measure everything that’s available on the dashboard. Select 3-5 KPIs that align with your business goals, like FCR, AHT, and CSAT.
Review: Check and adjust quarterly.
2. Blend insights with human review: Let automation spot trends, but don’t skip on listening to real calls. Use AI to flag issues, and QA teams to dive deeper.
Review: Ongoing (AI daily, human weekly)
3. Track both leading and lagging indicators:
Leading = hold time, call volume.
Lagging = resolution rate, escalation trends. You need both to fix issues before they explode.
Review: Weekly
4. Review dashboards: Don’t wait for a crisis. Conduct regular health checks on your call center analytics dashboard
Review: Monthly once
5. Share reports across teams: Marketing, Ops, QA—everyone needs visibility into KPIs. When everyone’s on the same page, goals get met faster.
Review: Weekly/monthly
FAQs: Call Center Analytics
What are the four types of analytics?
Descriptive, diagnostic, predictive, and prescriptive analytics—each helping you understand past trends, reasons behind them, forecast future outcomes, and decide next steps.
What are the four common KPIs used in call centers?
- Average Handle Time (AHT): The average time taken to complete a call, including talk time, hold time, and after-call work. Business standard: Around 6 minutes
- First Call Resolution (FCR): Percentage of issues resolved during the first interaction, without a follow-up. Good range: 70–80% • Industry standard: ~80%
- Customer Satisfaction (CSAT): Percentage of customers satisfied with their service after a call. Typical industry standard: 80–90%
- Call Abandonment Rate: Percentage of callers who hang up before speaking to an agent. Business ideal rate: Under 5%
What does a call center analyst do?
Call center analysts collect, interpret, and report on call data to identify performance trends and improve customer service efficiency.
How can call center analytics improve business performance?
You can improve outcomes by uncovering bottlenecks, tracking agent productivity, and aligning customer insights with business goals for smarter decisions.
Join the analytics revolution with Gaglers
Data doesn’t lie, and that’s why 66% of businesses are already investing in call center analytics. At the end of the day, every company wants to deliver a great customer experience. After all, happy customers mean growth and success.

But why make this move now? The call center analytics market is experiencing rapid growth and is expected to reach $5.75 billion by 2030. Investing in analytics today puts your business on the stronger side of that future.
Sign up with Gaglers now and take your call center performance to the next level with advanced analytics.
PS: More features in analytics are coming soon…..
Disclaimer: The images in this blog and editing was possible with the help of AI.